
KPI dashboard design: 10 metrics that agencies must show their clients
To succeed in the digital marketing world of 2026, you must track the right metrics. Discover the 10 critical KPI dashboard metrics that your agency should provide.
Do you feel like you're drowning in a sea of data when you look at that complex PDF report from your agency at the end of each month? Your advertising budget is spent, clicks are increasing, graphs are pointing upwards; but at the end of the day, can you not figure out how the net profit entering your cash register reflects in these tables? If you have started to ask yourself, "We got a lot of clicks this month, but why aren't the phones ringing?", the problem may not lie in your agency’s work, but in what and how they are reporting to you.
The world of digital marketing has become sophisticated enough by 2026 that it can no longer be managed with superficial metrics like "clicks" or "impressions". As a business owner, what you need now is not a pile of data, but actionable insights. In this guide, we will delve into 10 critical KPIs (Key Performance Indicators) that a digital marketing agency should provide you, which directly affect the future of your business, and how these metrics should be represented in a modern dashboard design.
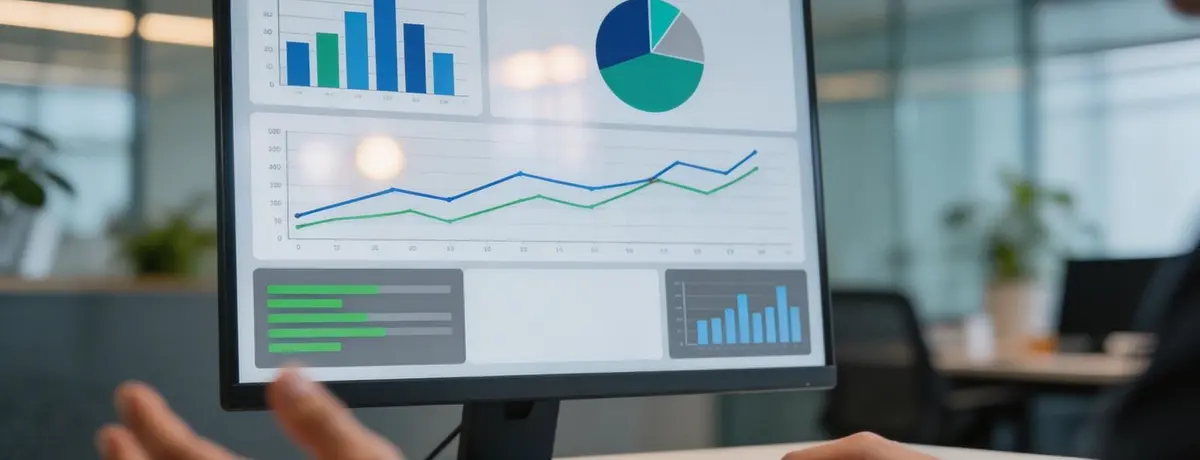
Modern digital marketing KPI dashboard screen
What is KPI Dashboard Design?
KPI dashboard design is the integration of the most critical datasets (KPIs) that show a business's progress towards its digital marketing goals into a real-time, visual panel. According to 2026 standards, these designs offer user-friendly and interactive interfaces that allow decision-makers to make strategic moves quickly by simplifying complex raw data.
In practice, we often see this: Many agencies present their clients with screenshots taken from Google Ads or Meta panels as reports. However, a professional approach requires blending data from different channels into one cohesive view that aligns with business goals. For example, if we only looked at the ROAS value in the advertising panel for one of our e-commerce clients, we would never see how return rates are eroding profitability. Thus, dashboard design should showcase not just "what is happening," but also "why it is happening."
Professional Tip: When designing your dashboard, apply the "3-second rule." When a manager looks at the panel, they should be able to understand whether things are going well within 3 seconds (with color codes or trend arrows). If it takes minutes of scrutiny to understand, that design is flawed.
The Evolution of Data in 2026: Why Standard Reports Are No Longer Enough?
In past years, an agency's success was measured by its ability to reduce "cost per click (CPC)." However, in 2026, we are in an ecosystem dominated by AI-powered advertising models and privacy-first data tracking. Technical requirements such as GA4 Consent Mode V2 installation have changed the data landscape. In this cookie-less world, dashboard designs that can model lost data are not a luxury but a necessity.
Based on our experience working with clients, the biggest drawback of standard reports is their lack of a "Business Intelligence" vision. A dashboard should not only describe the past; it should also whisper possible future scenarios using the predictive analytics power of 2026. You can create a basic Google Looker Studio report; however, establishing a specialized structure that integrates your data with your CRM data makes a difference.
Professional conducting interactive data analysis on a tablet
10 Critical Metrics Agencies Should Show to Their Clients
The metrics you should demand when working with an agency determine whether the agency is merely a technical executor or a strategic business partner. Here are those 10 metrics that define the 2026 agency reporting standards:
1. ROAS (Return on Ad Spend)
ROAS is the most fundamental indicator of success in advertising panels. However, in 2026, we do not merely see this as "Revenue / Spend." You must notably see the distinction between "New Customer ROAS" (nROAS) and "Existing Customer ROAS" on your dashboard. To understand how effective your ads are, you must track how your Google Ads strategies impact this metric.
2. MER (Marketing Efficiency Ratio)
One of the metrics that is often overlooked in the industry but is most important to us is MER. This ratio, obtained by dividing total revenue by total marketing expenditure, provides you with a bird's eye view of profitability. Given that data in advertising panels is not 100% accurate (due to cookie restrictions) during this period, MER is your compass.
3. CLV (Customer Lifetime Value)
Without knowing how much a customer will bring you over their lifetime, you cannot determine how much you can spend to acquire a new customer today. A professional agency should also report the loyalty of the acquired customer and the repurchase rates over time in the dashboard design.
4. CPA (Cost Per Acquisition)
What is the cost to acquire a new customer or a lead? In an analysis we performed at a leading industry firm, by tracking how the CPA rate changed over time, we shifted the budget to low-cost weeks, achieving a 30% increase in efficiency. You should see this metric separately for each channel (Meta, Google, TikTok).
5. Conversion Lag Time
How many days after a user clicks on your ad do they make a purchase? In 2026, purchase journeys are much more complex. If your product is high-priced, the decision process can take 15-20 days. If your dashboard does not show this process, you might think that a campaign that started 3 days ago was unsuccessful; instead, that campaign will yield results two weeks later.
6. First-Party Data Growth Rate
In this era where cookies are coming to an end, data such as the number of emails on your list, the number of SMS opt-in users is gold. You can measure whether your agency is not only bringing in sales but also building data assets with this metric.
7. Share of Search
What percentage of the total search volume in your industry is related to your brand? This metric is the clearest reflection of your market share in digital. Monitoring the increase of this share when receiving SEO services is real evidence of your brand awareness.
8. Assisted Conversions
Some channels do not score a goal but assist. For instance, a user may discover you through a YouTube ad (assist) and then come to buy through Google (goal). If you do not see the channels that provide assists in your dashboard design, you may mistakenly cut the budget saying "YouTube isn't working," which could lower your overall sales.
9. Brand Sentiment Score (AI Assisted)
In 2026, thanks to artificial intelligence, we are now adding "sentiment" data derived from social media comments to our dashboards. What percentage of what is said about your brand is positive, and what percentage is negative? This metric is vital for crisis management.
10. pROAS (Predictive ROAS)
Think of a metric that predicts what your end-of-month ROAS will be based on existing data using AI models. Adding these predictions to your dashboard with AI data analysis tools gives you tremendous flexibility in budget management.
Traditional Reporting vs. Strategic KPI Dashboard
The table below clearly summarizes why you need a comprehensive dashboard design instead of a simple report:
Özellik Geleneksel Raporlama (Eski Usul) Stratejik KPI Dashboard (212 Medya Standartı)
Veri Güncelliği Ayda bir kez, geçmiş verilerle. Anlık (Real-time), 7/24 erişilebilir.
Odak Noktası Tıklamalar, Gösterimler, CPC. Karlılık, MER, CLV, pROAS.
Analiz Derinliği Yüzeysel ve sadece panel verisi. CRM entegreli, omni-channel analiz.
Gelecek Öngörüsü Yok (Sadece ne olduğunu anlatır). Var (AI destekli trend tahminleri yapar).
Karar Verme Hızı Yavaş (Raporun gelmesi beklenir). Hızlı (Anlık veriyle anında aksiyon).
Application Suggestion: Request your current agency or marketing team to add at least 3 of the "Strategic" features listed in the table above to your dashboard. If their infrastructure is not suitable for this, it indicates that it's time for a technological transformation.
5 Critical Mistakes Commonly Made in Dashboard Design
Based on our experience working with clients, misrepresenting data leads to incorrect decisions. Here are the mistakes you should avoid:
- Data Vomit: Filling the panel with unnecessary hundreds of graphs. Remember, less but valuable information is always more valuable.
- Lack of Context: Presenting data without comparing it to the previous month or the same period last year. Is a 10% increase good? If the market grew by 50%, then a 10% increase is actually a failure.
- Visual Hierarchy Disorder: The most important metric (for example, Net Profit) being at the bottom of the page, while insignificant metrics (for example, Instagram follower growth) occupy the top.
- Mobile Compatibility Issues: Managers often check their dashboards on their phones while on the go. If the design does not work on mobile devices, it is a major shortcoming.
- Use of Technical Jargon: The report should be prepared not just for advertisers, but for business owners as well. There should be short and understandable explanations (tooltips) next to each metric.
Manager reviewing a mobile-friendly dashboard
Turn Data into Profit with 212 Medya
A well-designed KPI dashboard is like the difference between fumbling through the dark and walking towards your target with night vision goggles. At 212 Medya, we do not just present numbers to our clients; we uncover the business potential behind those numbers. In our data visualization processes, we use Google Looker Studio, Power BI, and custom software integrations to establish a transparent structure where you can instantly track all your business's digital muscles.
At a basic level, you can collect data from each panel yourself; however, transforming this data into strategic weapons requires technical expertise and deep industry experience. To stay one step ahead of your competitors in the competitive market of 2026, you must choose to manage data rather than just read it. Our expert team is always here to help you design the most accurate dashboard structure for your brand and manage your advertising budget with maximum efficiency.
Key Points
- KPI dashboards should be real-time and accessible 24/7.
- Focus should be on profitability metrics such as ROAS and MER instead of metrics like clicks and impressions.
- Predictive analyses like pROAS, a trend in 2026, should be incorporated into strategy.
- First-party data (CRM) growth should be reported as an integral part of advertising success.
- Dashboard design should comply with the "3-second rule," be simple, and mobile-friendly.
- Both main conversions and assisted conversions (assist channels) should definitely be tracked.
Frequently Asked Questions
Which tools should be used for dashboard design?
In 2026, the most commonly used tools are Google Looker Studio, Microsoft Power BI, and Tableau. For small and medium-sized enterprises, Looker Studio offers the most cost-effective solution in terms of cost and integration, while Power BI may be preferred for massive data sets.
Does my agency's report only having Google Ads data suffice?
Absolutely not. Google Ads data alone is just one piece of the picture. You should demand an "omni-channel" dashboard that integrates your Meta, TikTok, SEO, and even offline sales data (CRM).
Why is conversion tracking so important for the dashboard?
If the proper tracking infrastructure (for example, Server-Side Tracking) is not established, the data you see on your dashboard may be erroneous by up to 30%. Decisions cannot be made accurately with incorrect data. Not setting up tracking and advertising is like driving a car with your eyes closed.
Are dashboard setup costs high?
Setup costs vary depending on the complexity of the data and the number of channels to be integrated. However, this is not an expense; it is the most critical investment that prevents your advertising budget from being wasted and increases your ROI.
Can I create my own dashboard?
Yes, you can establish a basic structure with tools like Google Looker Studio. However, for data blending, advanced metric calculations, and the technical requirements of 2026 (API connections, AI models), getting professional agency support is crucial for the accuracy of your results.
The road to success in digital lies in measurable and manageable data. If you want to see the digital X-ray of your business in real-time and construct your strategy based on data, get in touch with the 212 Medya team now and let’s design your customized dashboard solution together.